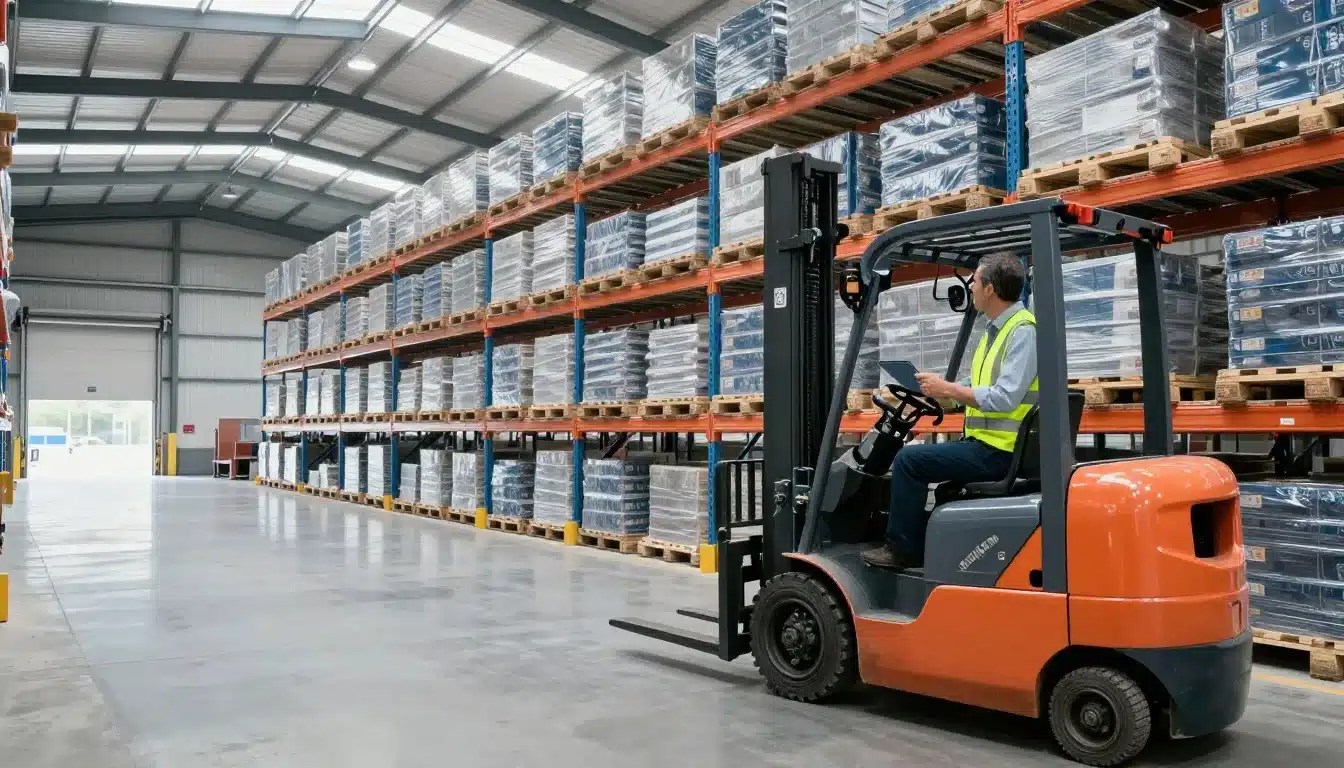

Warehouse capacity is more than the square footage on your lease. Storage space, product flow, labor, equipment, and order volume all determine whether your operation can meet demand without creating overcrowded aisles, slow picking, misplaced inventory, overtime, delayed shipments, or costly expansion decisions.
Warehouse capacity planning helps you match available resources to current and future demand. This guide covers capacity calculations, demand forecasting, layout, labor, technology, warehouse performance metrics, and practical steps to improve how your facility uses space and handles orders.
What Warehouse Capacity Planning Really Means
Warehouse capacity planning is the process of matching storage and operational resources with current and future demand. It helps you answer a practical question: can the facility hold the inventory and process the work required without creating congestion, overtime, delays, or unnecessary expansion?
Capacity includes more than square footage. You may measure it in pallet positions, cubic feet, bin locations, cases, order lines, picks per hour, or dock moves per shift. A warehouse can have open floor space and still be at capacity if receiving, picking, packing, or shipping cannot keep pace.
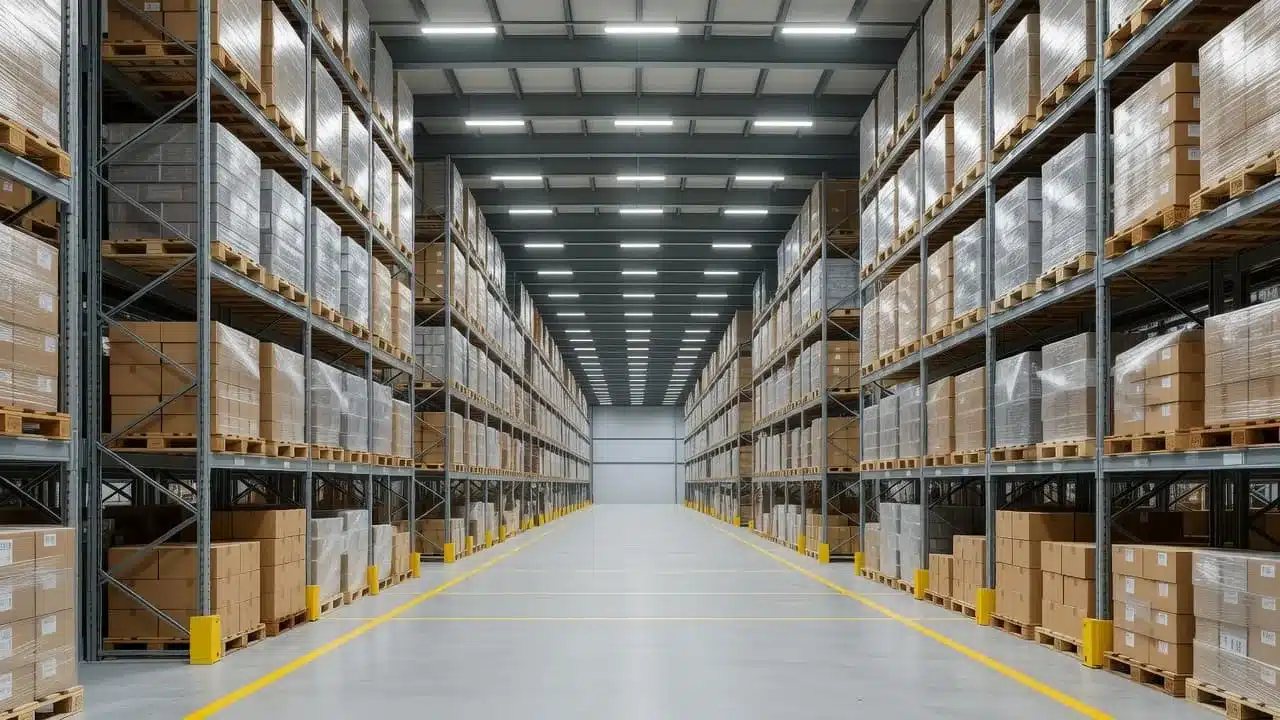
### The four capacity limits every warehouse must balance
Warehouse capacity has two useful levels. Static capacity is the physical maximum, such as every available rack position or cubic foot filled safely. Usable capacity accounts for aisles, staging areas, receiving and packing zones, safety clearances, equipment, labor, and workflow. In practice, usable capacity is the number that guides daily decisions.
Four connected limits shape that number:
- Storage capacity covers pallet positions, shelving, bins, reserve stock, and pick locations. Slotting rules, aisle width, product dimensions, stacking limits, and required access reduce the amount of space you can use.
- Throughput capacity measures how much inventory the warehouse can receive, put away, pick, pack, and ship within a set period. It is a flow limit, not a space limit.
- Labor capacity reflects the available hours, skills, productivity, and shift coverage of receiving, picking, packing, and shipping teams. A building may have room for more orders, but not enough people to process them.
- Equipment and dock capacity includes forklifts, pallet jacks, conveyors, scanners, charging stations, dock doors, and staging space. These resources control how quickly goods enter, move through, and leave the facility.
A shortage in one area restricts the others. Extra rack space won’t help if inbound teams cannot unload and put away inventory. More workers won’t solve a bottleneck when forklifts, dock doors, or packing stations are fully occupied. Similarly, receiving can process every delivery, but the operation still falls behind if pickers cannot complete orders before carrier cutoffs.
As a result, capacity planning should track storage and movement separately. Warehouse utilization metrics can show how much space is occupied, but managers also need throughput and labor data to find the real constraint. Live inventory and workflow data from warehouse software for real-time decisions makes those limits easier to compare during normal days and seasonal peaks.
Why capacity planning matters for cost, service, and growth
Good planning protects inventory accuracy because overcrowded locations encourage rushed putaway, misplaced stock, and duplicate handling. It also gives pickers clearer paths, reduces rework, and helps orders leave before shipping cutoffs.
The financial effect reaches beyond labor cost. Congestion increases travel time, product damage, overtime, excess handling, and temporary storage needs. Meanwhile, missed orders and late shipments weaken customer trust and reduce margin.
Capacity planning also supports safer growth. By improving layout, labor scheduling, slotting, and equipment use, you may delay a facility expansion without forcing the current building beyond its practical limits. The goal is enough room and processing power to meet demand while preserving accuracy, safety, service, and profit.
How to Calculate Warehouse Capacity Step by Step
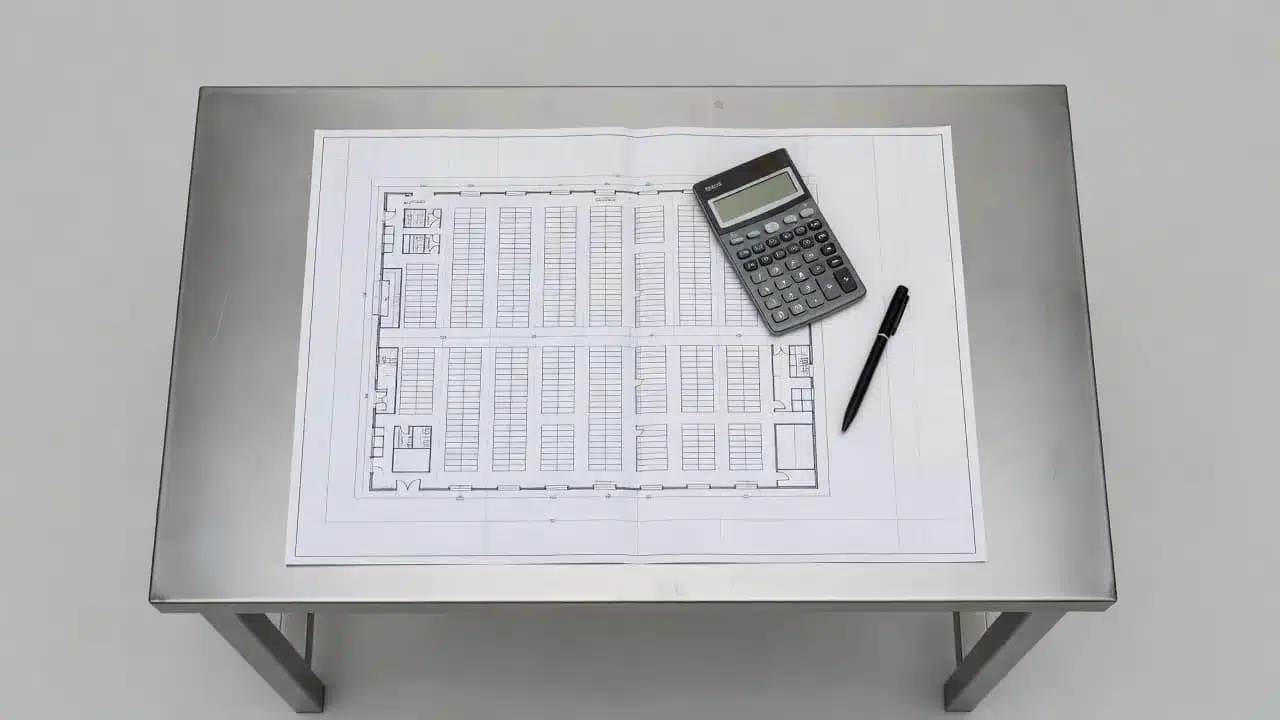
A reliable warehouse capacity calculation combines floor area, vertical space, storage equipment, and order activity. Use a floor plan, spreadsheet, or WMS data to separate theoretical capacity from the space and workload your operation can handle safely.
### Measure usable space, not empty space
Start with the building’s total square footage. Then subtract areas that cannot hold inventory, including offices, restrooms, break rooms, loading zones, electrical rooms, columns, safety clearances, and fixed equipment.
For example:
- Total warehouse area: 150,000 square feet
- Non-storage area: 30,000 square feet
- Area remaining before layout limits: 120,000 square feet
That 120,000 square feet is a starting point, not your final storage capacity. Open floor area must still support aisle width, forklift turning space, fire access, pedestrian paths, receiving, shipping, and staging. You may also need dedicated locations for quarantine stock, returns, damaged goods, value-added services, and temporary overflow.
A rough early-stage estimate may reserve about 30% of the total surface area for movement and support activities. However, the correct ratio depends on the building shape, storage system, product dimensions, fire requirements, and material-handling equipment. Counterbalance forklifts usually need more maneuvering room than narrow-aisle equipment.
Next, measure clear height, from the floor to the lowest obstruction, such as a beam, sprinkler, light, or duct. Subtract the required safety clearance, then apply the safe stacking or rack height. Multiply the usable floor area by that usable height to estimate cubic capacity:
Usable floor area × usable storage height = theoretical cubic capacity
For the example, 120,000 square feet multiplied by a 24-foot usable height produces 2,880,000 cubic feet before rack, aisle, and utilization adjustments. Warehouse size planning guidance can help you compare this early estimate with rack levels and gross floor requirements.
Use pallet positions, cubic feet, and order flow together
Pallet positions are the clearest measure for palletized goods. Count the rack bays, rack levels, and pallet locations per bay:
Rack bays × rack levels × pallet locations per level = pallet positions
For example, 40 bays with four levels and two pallets per level provide 320 pallet positions. Confirm the result against actual bay width, pallet dimensions, aisle layout, load limits, and required clearance. A warehouse management system for 3PL operations can help compare available locations with live inventory and demand.
Cubic feet works better when products have different sizes or stackability. A small carton and a bulky appliance may each occupy one location but consume very different amounts of space. Calculate each product’s length, width, and height, then compare total inventory volume with usable warehouse volume.
Order lines, picks per hour, and orders per shift measure flow capacity. They show whether receiving, picking, packing, and shipping can handle demand. A warehouse may have empty rack positions but still lack enough labor, dock time, or packing capacity.
Use pallet positions for storage, cubic feet for physical volume, and order flow for workload. One number cannot describe a mixed-product or e-commerce operation.
Finally, reserve a planning buffer of about 10% for seasonal spikes, growth, inventory variation, and temporary disruptions. Treat that buffer as unavailable in normal planning, rather than filling every location on paper.
Forecast Demand Before You Add More Storage
Adding storage before understanding demand can leave you paying for empty locations while bottlenecks continue elsewhere. Build a capacity forecast that connects inventory levels, order volume, labor, dock activity, and picking requirements to the demand you expect.
Build a SKU-level capacity forecast
Start with historical orders and inventory records, then add planned changes from sales, marketing, purchasing, and customer teams. Review each SKU’s average inventory, peak inventory, reorder point, velocity, and expected demand by week. Include case pack, pallet pattern, product dimensions, and handling needs, such as temperature control, serial checks, fragile-item processing, or special packaging.
Accurate dimensions are essential. A small error in carton height can distort cubic capacity, pallet counts, rack requirements, and slotting decisions across thousands of units. Confirm measurements for the packaged product, not just the item itself.
Your forecast should also account for supplier lead times, inbound quantities, returns, new product launches, promotions, and new customers. Average demand alone won’t show the real constraint. A holiday promotion may create a sharp inbound surge before sales peak, while returns may fill inspection and restocking areas after the event.
Use ABC analysis to guide space and access decisions. Fast-moving A items should sit in accessible pick locations with enough replenishment stock nearby. B items can use standard locations, while slow-moving C items may fit in denser racks or less convenient areas. Review the classification regularly because product velocity changes.
For operations across several facilities, a location-specific demand forecast prevents one warehouse from carrying excess stock while another runs short. Compare projected inventory with available pallet positions, cubic volume, pick faces, labor hours, dock appointments, and packing capacity.

### Plan for seasonality, growth, and reserve capacity
Build at least three scenarios:
- Expected demand based on current sales, known customer orders, and normal growth.
- High-growth demand that includes stronger sales, new accounts, or successful promotions.
- Peak or disruption demand that allows for holiday volume, launch spikes, supplier delays, or unusually high returns.
For each scenario, compare projected inventory and order volume with storage, labor, dock, and picking capacity. A clear utilization threshold should trigger action before aisles become crowded. For example, once usable storage reaches the level where replenishment locations, staging space, or safety paths become difficult to maintain, activate the response plan.
That response might include temporary storage, overflow space, additional shifts, revised slotting, or phased expansion. Keep a reserve instead of filling every location during normal weeks. Update the forecast weekly during peak periods and on a regular schedule during stable periods. Capacity planning is a living operating process, not a one-time spreadsheet exercise. Use demand planning and replenishment data to adjust assumptions as sales, lead times, and returns change.
Improve Warehouse Capacity Through Layout, Slotting, and Storage
Effective capacity improves when your layout supports product flow instead of simply holding more inventory. Map receiving, reserve storage, forward pick locations, replenishment paths, packing, shipping, returns, quarantine, and inspection zones around actual movement. The best layout reduces travel and touches while protecting safety, accuracy, and throughput.
### Use slotting to put the right products in the right places
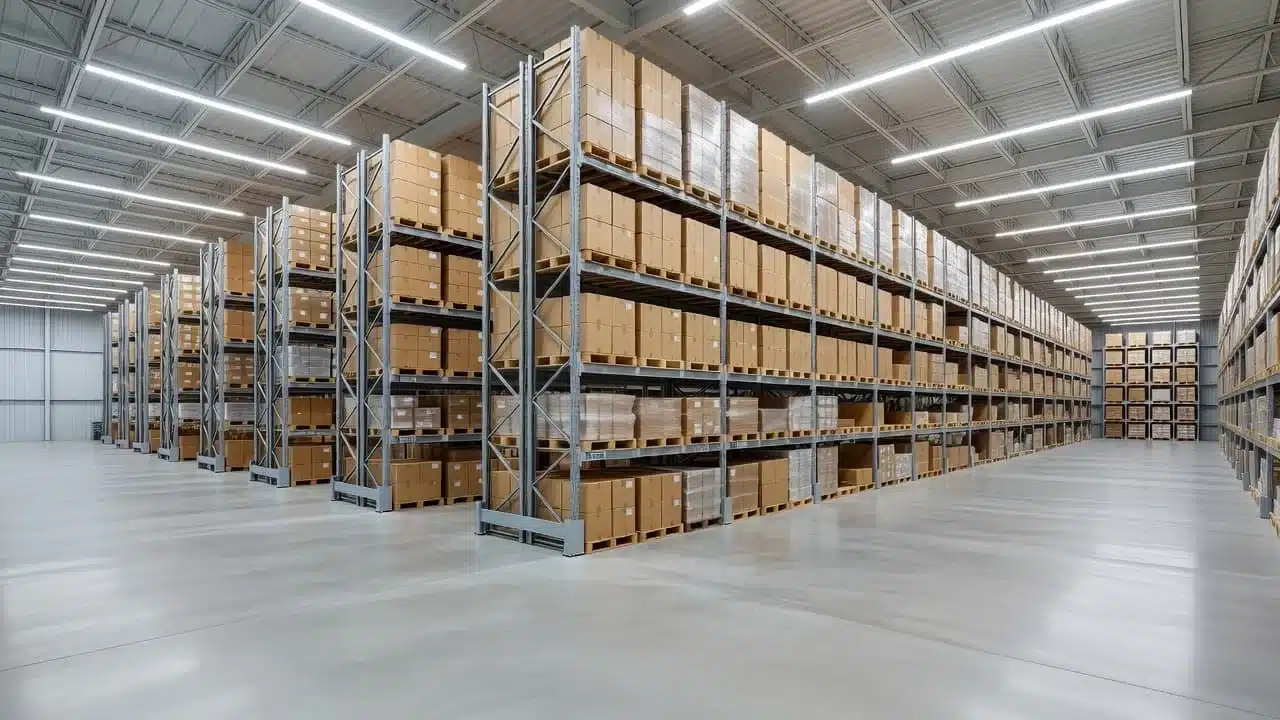
Slotting should reflect how each SKU moves through your warehouse. Review velocity, product size, weight, order frequency, demand relationships, and handling requirements before assigning a location.
Fast-moving products usually belong near picking, packing, or shipping areas when the layout allows it. Keep frequently purchased items together when order data shows a strong relationship. This reduces travel for multi-item orders and limits unnecessary touches. Pick path optimization can help you identify where poor placement creates excess movement.
Heavy or oversized products need safe working heights, stable rack positions, and equipment that can handle their loads. Reserve the easiest reach zones for frequent picks that workers can handle safely. Fragile, temperature-sensitive, hazardous, or serialized products may need dedicated locations, even if those locations are less convenient.
Review slotting regularly because demand changes. A product that was once slow may become a top seller after a promotion, while an old bestseller may occupy valuable forward-pick space after demand falls. Monthly performance reviews and quarterly location adjustments can prevent outdated assumptions from creating long travel paths, replenishment work, and congested aisles.
Choose storage density without slowing the operation
Higher-density storage can increase pallet positions, but access often becomes harder. Adjustable pallet racking offers flexible, direct access for varied SKUs. Narrow aisles use space efficiently, but they require compatible forklifts, trained operators, and careful traffic control. Double-deep racks add density for reserve inventory, yet they can increase replenishment time because one pallet may block another.
Shuttle systems, vertical lift equipment, stackable bins, and mezzanines can expand usable capacity without adding floor area. However, each option brings equipment costs, maintenance needs, safety requirements, and possible bottlenecks. A mezzanine may create useful pick or packing space, but workers still need safe access and replenishment routes.
Before changing the layout, check:
- Forklift type, turning radius, and lift height
- SKU variety and required access frequency
- Replenishment time and reserve stock levels
- Fire codes, sprinkler clearance, and emergency paths
- Rack loads, worker ergonomics, and pedestrian safety
Dense storage fits slow-moving or bulk products better than fast movers. Storage optimization guidance can help compare cube utilization with access requirements. If dense storage slows picking or hides inventory, the extra positions may reduce usable capacity.
Separate storage capacity from process capacity
A warehouse can have open rack space and still lack enough dock, staging, packing, or inspection capacity. Map one-way movement where practical, remove dead zones, mark receiving and shipping lanes, and set clear staging rules for each shift.
Cross-docking can move eligible inbound goods directly to outbound staging instead of placing them into reserve storage first. Returns and damaged inventory should use separate lanes for inspection, quarantine, repair, resale, or disposal. Otherwise, they consume active pick locations and create inaccurate availability.
Capacity improves when every zone has a purpose, a location rule, and a next action. Scannable location records and real-time inventory updates help teams keep storage decisions aligned with actual warehouse flow.
Match Labor, Equipment, and Dock Capacity to Demand
Warehouse capacity depends on people and material-handling equipment as much as racks and floor space. A useful plan connects forecasted volume with labor hours, shift coverage, forklift availability, dock appointments, battery charging, and maintenance time. Otherwise, adding storage can leave the real constraint untouched.
Calculate workload by warehouse process
Convert the forecast into work units for each process, then divide by a realistic productivity standard:
Required labor hours = forecasted workload ÷ units per labor hour
Use separate calculations for receiving, putaway, replenishment, picking, packing, shipping, cycle counting, returns, and maintenance. For example, forecasted pallet receipts can become receiving and putaway hours, while order lines become picking hours. Cartons translate into packing and shipping work, and returned units require inspection, disposition, restocking, or quarantine time.
Build two versions of the plan: one for a normal day and another for peak demand. Apply actual productivity data, such as picks per labor hour, cartons packed per hour, dock turnaround time, order cycle time, and training time to standard. Do not compare rates unless the units match. A pick may mean a line, piece, case, or pallet, and each measure produces a different result.
Review labor by process, shift, and skill, not only by total headcount. A shift may have enough employees overall but lack a certified reach-truck operator, shipping clerk, or returns specialist. High turnover also creates continuing training demand, so track how many shifts new employees need before reaching the target rate.
The goal is to identify the constraint before adding staff everywhere. If pickers are waiting for replenishment, more pickers will not solve the delay. If packing queues grow while picking stays on target, add stations, packers, or supplies instead. Use warehouse bottleneck analysis to compare units per labor hour, forklift utilization, packing rate, and queue growth.
A warehouse can be fully staffed and still miss its shipping cutoff when the wrong skill, process, or equipment limits the flow.
Protect capacity with training, cross-training, and maintenance
Standardized work helps new employees reach target performance sooner. Give each role a clear sequence, barcode-based mobile workflow, defined quality checks, and practical training examples. Scanning the item, location, quantity, and carton at each movement reduces reliance on memory and creates a consistent record.
Cross-train employees for adjacent roles, especially receiving, replenishment, packing, shipping, and returns. Maintain a skill matrix that shows who can cover each process and shift. This protects capacity during absences, promotions, and peak weeks without assigning unqualified workers to powered equipment.
Equipment planning needs the same discipline. Count available forklifts, pallet jacks, scanners, conveyors, charging stations, dock doors, and packing stations against the workload. Check whether battery charging creates a shift change bottleneck, whether conveyor limits create packing queues, and whether carrier appointment windows leave enough time for loading.
Preventive maintenance protects capacity before a breakdown removes it. Schedule inspections and service for forklifts, conveyors, scanners, dock levelers, doors, and other critical equipment. Safe workarounds may slow the operation, while unsafe workarounds create damage and injury risks. Finally, pair productivity with accuracy, because rushing throughput can produce mispicks, rework, inventory errors, short shipments, and returns. A warehouse management system that reduces errors helps connect labor output with the quality of each completed movement.

## Use WMS Data and Automation for Better Capacity Planning
A warehouse management system gives planners a current view of inventory locations, quantities, dimensions, movements, order demand, receiving activity, picking workload, and available capacity. Instead of planning with outdated spreadsheets, you can compare physical space with the work moving through each zone.
That visibility only helps when the underlying records are accurate. Use barcode scanning and mobile workflows at every major handoff, then connect warehouse data with your ERP, e-commerce, accounting, EDI, and shipping systems. A shared data flow reduces duplicate entry and gives planners a clearer view of demand, inventory, and capacity.

### Start with accurate inventory and product data
Bad dimensions, incorrect locations, duplicate SKUs, and unrecorded movements can make a capacity model look precise while producing unreliable results. If the system thinks a carton is smaller than it is, or shows stock in a location where it no longer exists, your storage forecast starts with the wrong inputs.
Barcode scans at receiving, putaway, picking, shipping, adjustments, and returns keep inventory records closer to physical reality. Mobile workflows also prompt workers to confirm the item, location, quantity, and status before completing a movement. Support these controls with cycle counts, reason-coded adjustments, and regular master-data checks for dimensions, weights, case packs, and unit conversions.
Inventory accuracy matters even more when you handle returns, damaged goods, quarantine stock, or multiple warehouses. These items may exist physically but remain unavailable for sale, production, or allocation. A WMS platform for accurate inventory can help separate statuses and locations so planners don’t count restricted stock as usable capacity.
Use reporting to find the real constraint
Dashboards and alerts should show more than total warehouse utilization. Review space utilization, inventory by location, stock movement, aging inventory, returns by SKU, receiving backlog, picks per hour, order cycle time, mispicks, restock time, dock turnaround, and on-time shipping.
Then connect each report to a decision. High space usage may call for a slot change or dead-stock removal. A receiving backlog may require another shift, revised appointments, or faster putaway. Rising restock time may point to a poor returns lane, while low picks per hour may justify a new path or replenishment schedule.
A warehouse inventory accuracy system can also help teams compare scan activity, discrepancies, and movement history instead of reviewing isolated counts. Keep reports focused enough that every trend leads to an owner and a process change.
Model changes before making expensive investments
Spreadsheets work well for basic scenarios, such as testing peak inventory, an added shift, a new product line, or changed carrier cutoffs. For larger changes, simulation, digital twins, and planning software can test rack layouts, traffic patterns, labor levels, or another facility before construction or equipment purchases begin.
Compare each scenario against more than expected capacity gains. Include implementation cost, safety impact, labor needs, training, maintenance, throughput, order cycle time, and on-time shipping results. A larger rack footprint may add positions but reduce staging space. Automation may increase pick speed but create a packing bottleneck.
Use dashboards, slotting tools, demand forecasts, labor planning, and IoT sensors where they solve a defined constraint. Automation should remove a bottleneck, not add another system for employees to maintain.
Track the Warehouse Capacity Metrics That Drive Action
Capacity metrics should show whether your warehouse has enough room and processing power to meet demand. Review physical occupancy separately from operational performance, then connect both to customer service and margin. A useful KPI belongs in a regular meeting only when a change in the number can trigger a process decision.

### Measure utilization without creating congestion
Filling every location is not the goal. High occupancy can block aisles, increase travel distance, restrict replenishment access, and push cartons into unsafe staging areas. Track space utilization, storage density, pallet positions used, and cubic utilization to understand physical occupancy. Storage cost per unit and inventory turnover add a financial view, showing whether occupied space supports productive inventory or slow-moving stock.
Operational metrics tell you whether that space works. Monitor throughput, picking efficiency, order fulfillment accuracy, dock turnaround time, receiving backlog, shipping backlog, time to restock returns, and on-time ship rate. For example, rising pallet utilization may look positive until pick rates fall, replenishment takes longer, or dock staging becomes crowded.
Set thresholds for each warehouse and zone, then review trends by SKU category, shift, and season. A dense reserve-storage zone may support a higher occupancy level than a fast-pick area. Similarly, peak-season limits may need to trigger overflow storage or extra labor before normal capacity is exhausted. ASCM’s warehouse KPI guidance also emphasizes connecting warehouse measures to cost and customer satisfaction.
A utilization percentage becomes useful when it tells a manager what to change next, such as re-slotting inventory, adding a shift, or limiting inbound appointments.
Connect capacity metrics to customer service and margin
Space and flow problems appear in customer-facing results. A crowded pick area can produce mispicks and late shipments. A receiving backlog can create stockouts even when inventory has arrived. Slow returns processing delays refunds, increases support contacts, and keeps sellable products out of inventory.
Review these measures together:
- Order accuracy and on-time ship rate show whether capacity issues are reaching customers.
- Extra touches, dock turnaround, and backlog reveal wasted labor and process delays.
- Time to restock returns shows how quickly returned inventory can recover its selling value.
- Contacts per return exposes friction caused by unclear status updates or manual steps.
Calculate cost per return with a formula the team can defend: label and inbound shipping, handling labor, packaging, loss in value, and disposal. Handling minutes count because every inspection, repack, approval, and putaway touch requires paid labor. A returned $50 item may lose $10 in value after resale, require $4 in handling, and add packaging and shipping costs before disposal is considered.
Compare that cost with margin, exchange rate, recovery rate, and refund time. If a SKU has high returns and frequent customer contacts, improve its product information or fit guidance. If restocking remains slow, change the returns lane or scan workflow. Metrics earn a place in the weekly meeting when they lead to a defined owner, threshold, and process change.
A Practical Warehouse Capacity Planning Process You Can Repeat
Capacity planning works best as a regular operating process, not a one-time expansion exercise. Start with what exists, test practical changes, and use measured results to decide whether you need more space, labor, or outside support.
Create a capacity baseline and find the biggest constraint
Begin with a physical walk-through and a clean data set. Measure the building, usable storage area, clear height, rack and bin locations, dock doors, staging zones, and equipment paths. Then collect:
- Current and peak inventory by SKU
- Product dimensions, weights, case packs, and pallet patterns
- Order volume, order lines, picks, and returns
- Labor hours by process and shift
- Forklifts, scanners, conveyors, packing stations, and charging capacity
- Service targets, such as order cutoffs and on-time shipping goals
Compare these records with what you see on the floor. A spreadsheet may show inventory in a location that is blocked, mislabeled, empty, or holding damaged goods. Ask receiving, picking, packing, and returns employees where work actually waits. Their observations often expose constraints that reports miss.
Map storage, receiving, putaway, replenishment, picking, packing, shipping, and returns separately. Then identify the first area where work queues grow. That may be a full pick module, slow replenishment, limited dock time, poor scan compliance, or insufficient labor during a specific shift. A smart warehouse software guide can help connect floor activity with inventory and workflow records.
Test low-cost improvements before expanding
Run a short improvement cycle with two or three controlled changes. Establish a baseline first, then change one zone, shift, or process so you can compare results fairly. Useful tests include:
- Re-slotting high-velocity SKUs closer to packing
- Removing obsolete or dead stock from prime locations
- Changing replenishment times to avoid pick-hour interruptions
- Requiring scans at receiving, putaway, picking, and returns
- Adjusting dock appointments to reduce inbound surges
- Using safe unused vertical space
- Creating a dedicated returns or quarantine lane
- Cross-training employees for a constrained process
Track pick speed, order accuracy, safety incidents, backlog, overtime, travel time, and cost per order before and after each test. For returns, separate fast-moving apparel that can be inspected and reshelved quickly from electronics that require testing or serial checks. Review return reasons as well, since repeated fit, damage, or description problems may require product or packing changes.
Use warehouse storage optimization techniques as a reference, but validate every idea against your building and equipment.
Know when a larger facility or outside partner is justified
Expansion makes sense when demand consistently exceeds safe usable capacity, peak overflow disrupts service, or labor and travel costs keep rising despite process improvements. The current building may also lack the clear height, dock access, equipment space, or flow needed for your service targets.
Before signing a lease or building out space, compare the full cost and risk of other options. Consider a third-party logistics provider, temporary overflow storage, phased growth, an additional shift, redesigned storage, or inventory balancing across facilities. Include rent, labor, transportation, implementation time, training, equipment, and service impact.
Review the plan monthly using current inventory, utilization, backlog, labor, and service results. Complete a deeper quarterly or seasonal review before promotions and peak periods. Assign an owner to each action, set a decision date, and expand only when measured improvements no longer close the capacity gap.
Conclusion
Effective warehouse capacity planning balances space, inventory, flow, labor, equipment, and demand. Measure usable capacity, forecast normal and peak needs, improve slotting and layout, protect data accuracy, and track KPIs that lead to clear decisions.
Review the plan regularly as products, customers, order patterns, and operating constraints change. The goal isn’t to fill every inch, but to maintain enough safe, accessible capacity to meet demand at a profitable service level.