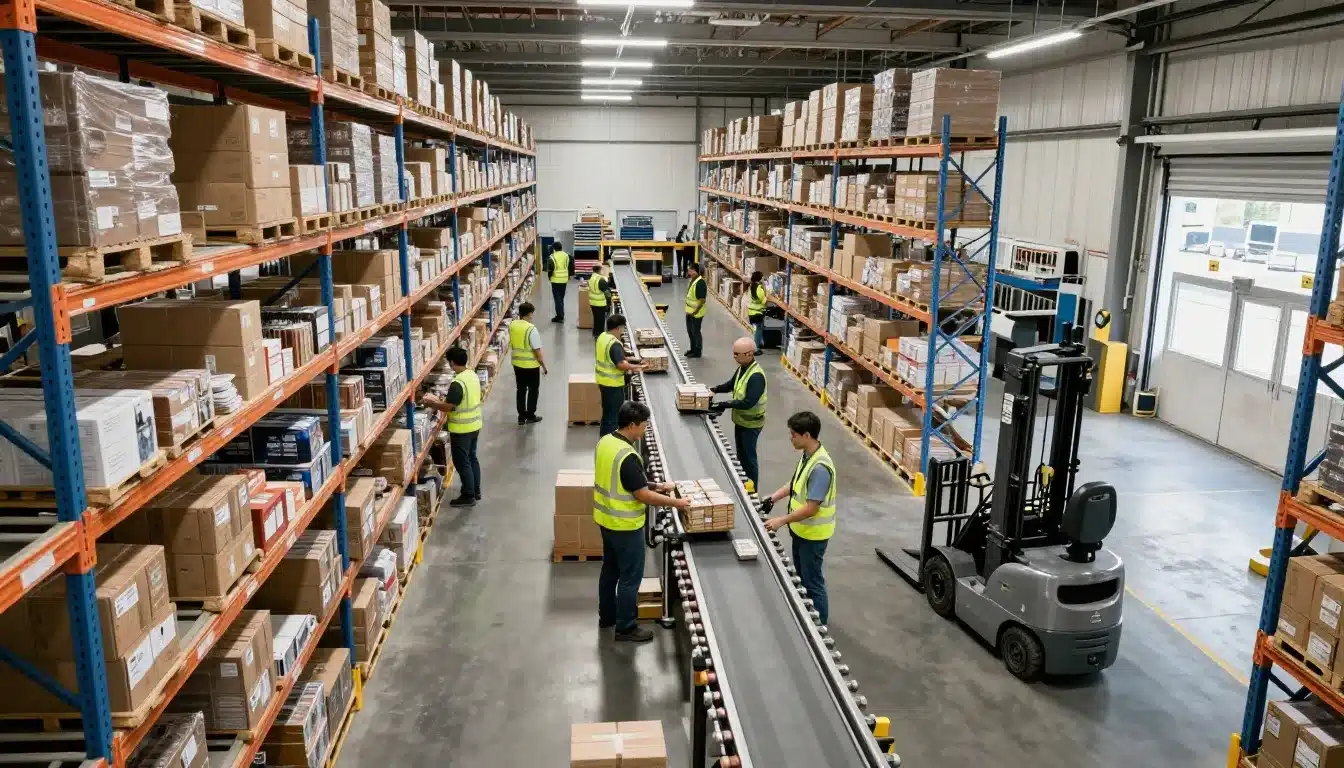
Orders keep coming in, people keep moving, but shipping is still late and overtime keeps climbing. When that happens, the problem usually isn’t effort, it’s flow.
A warehouse bottleneck is one slow step that holds back everything behind it, like a backed-up pack station, a short-handed receiving lane, or a dock that can’t turn trailers fast enough. Even a small delay at one point can ripple across picking, packing, and shipping.
In 2026, these slowdowns hit harder because labor gaps don’t go away, inventory visibility still breaks down, dock scheduling stays tight, and returns keep growing. As a result, teams end up firefighting instead of fixing the real constraint.
This post gives you a clear way to spot where work stacks up, measure how much time and money it’s costing, and choose fixes you can trust. You’ll learn what to watch on the floor, what to pull from your systems (including ERP-WMS integration for fewer delays), and how to confirm the bottleneck actually moved after you change something.
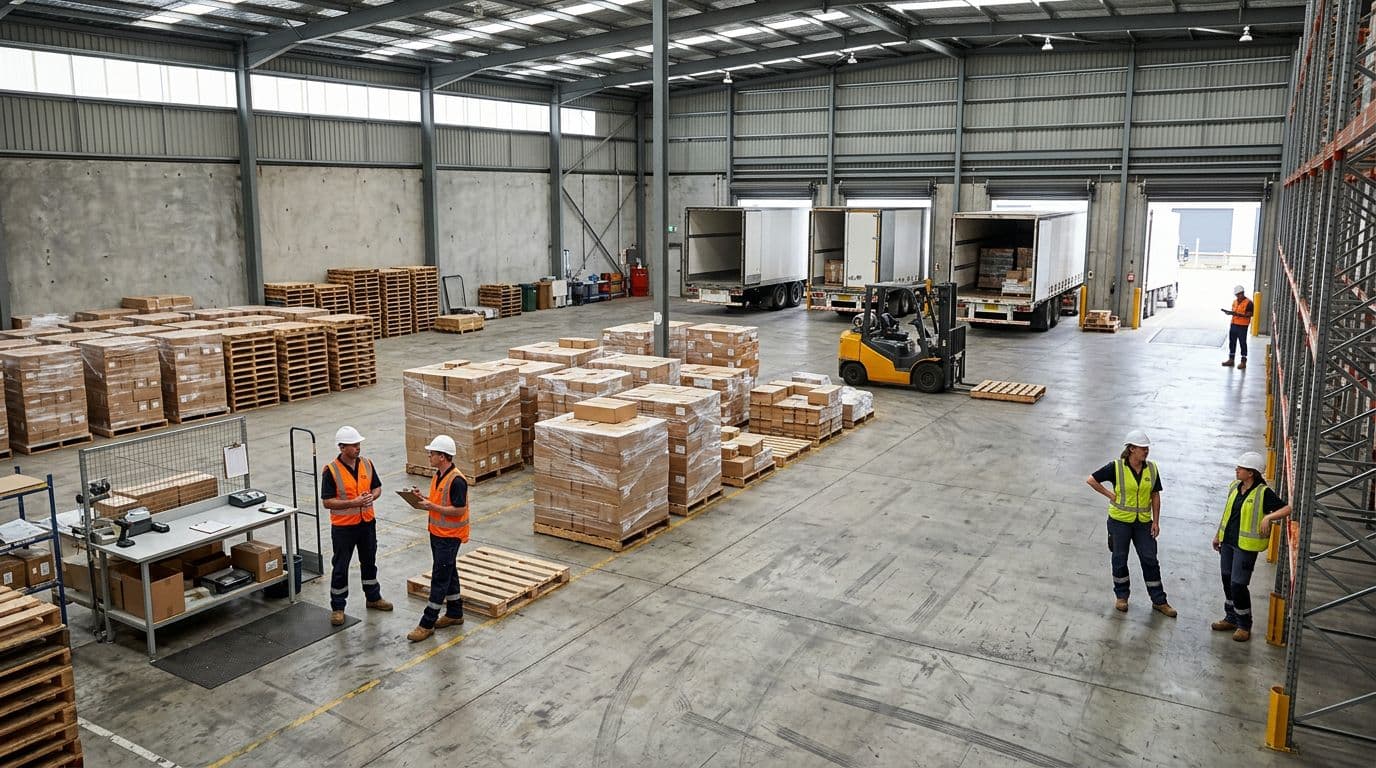
Start with the flow, map how work really moves through the warehouse
You can’t fix what you can’t see. Before you debate headcount or buy equipment, map the actual flow, end to end. Keep it practical: start with one product family (your highest volume SKU group) or one shift (day shift, weekends, or peak cutoffs).
Walk the floor with a clipboard. Shadow a receiver, then a picker, then a packer. Compare the “official” SOP to what people really do when they’re under pressure. That gap is where delays live.

Trace the four main paths: receiving, put-away, picking, and shipping
Think of these as the four highways your inventory rides every day.
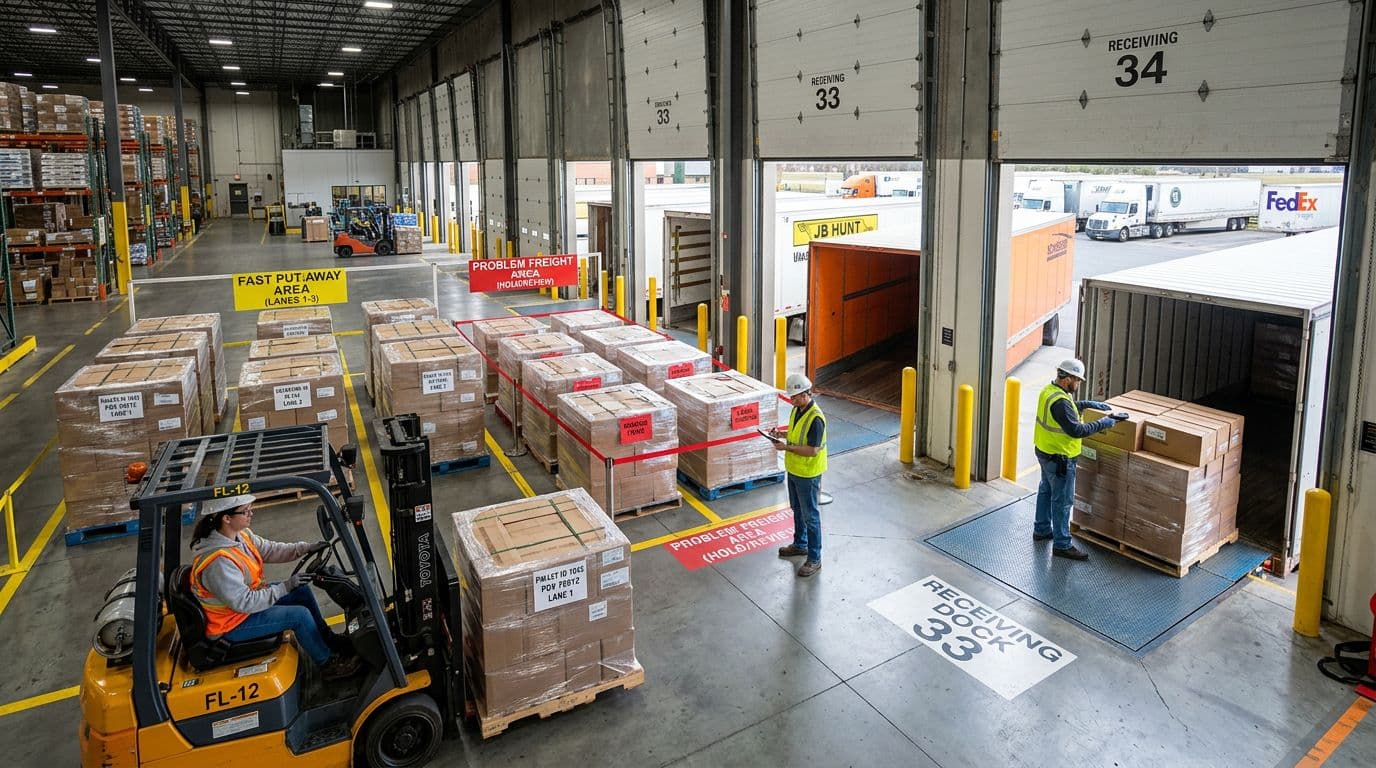
Receiving starts when a trailer hits a door. A team unloads, counts, checks damage, and confirms what arrived matches the ASN or PO. “Good” looks like clear staging lanes, fast labeling, and nothing parked “for later.”
Put-away is moving product from receiving to a home location. “Good” means location rules are simple (reserve vs pick face), scanners confirm every move, and the dock clears quickly.
Picking pulls items from pick faces or reserve to build orders. “Good” looks like stocked pick faces, short walks, and clear priorities so pickers don’t bounce between urgent jobs. If you need a practical way to reduce walking, pick path optimization in warehouses is often the fastest win.
Shipping is pack, verify, stage, load, and close out. “Good” means pack benches do not flood, cartons flow to the right carrier, and staged freight matches the trailer plan.
Typical choke points to watch for:
- Receiving: staging area full, missing labels, long check-in waits
- Put-away: no empty locations, forklift queues, unclear slotting rules
- Picking: pick faces empty, location errors, congestion in hot aisles
- Shipping: packing benches backed up, QC pileups, trailers waiting for a door
Include the hidden work that steals time: replenishment, exceptions, and returns
Most Warehouse maps lie because they ignore the surprise work. Replenishment runs pull people off picking. Exceptions turn into scavenger hunts. Returns require inspection, decisions, and re-boxing, and they hit when you are already busy.
In 2026, this matters more because return volumes are much higher than a few years ago. Some retail categories see return rates above 30% online, and overall retail returns sit near the high teens. If your operation treats returns as “extra,” they will swamp your labor and your space.
Map these flows like they are first-class work:
- Replenishment: what triggers it, who does it, where stock waits
- Exceptions: short picks, damages, missing inventory, order holds
- Returns: receive, sort, inspect, restock, refurbish, or scrap
If the team says, “returns are killing us,” but the map doesn’t show returns, the map is the problem.
Mark every handoff and wait state, because waiting is where delays hide
A bottleneck often looks like people working hard while work sits still. Your map should spotlight every queue. For example: pallets waiting for a forklift, orders waiting for QC, trailers waiting for a door, and pickers waiting for replenishment.
Use simple visual rules so anyone can read it in seconds:
- Touch (someone handles it): mark with a solid dot
- Move (it travels): mark with an arrow
- Wait (it queues): mark with a red box (or any single, loud color)
Once you mark waits, you stop arguing opinions. You can point to a box on the map and say, “This is where time disappears,” then measure it.
Prove where the bottleneck is with a few numbers that tell the truth
You don’t need a complex dashboard to find a warehouse bottleneck. You need a lightweight measurement plan you can run for 1 to 2 weeks, then compare it to what you saw on the floor.
Start simple: pick one shift, one product family, and one weekly pattern (like Mon to Fri days). Track a handful of time, capacity, and quality signals. Then pair the numbers with daily observation, because the bottleneck is usually the step with the longest queue and the least spare capacity.
Track time-based signals: queue time, cycle time, and dock-to-stock
Time metrics tell you where work sits still. Keep definitions plain so everyone measures the same way.
- Queue time: how long work waits before someone starts it. Example: pallets staged at receiving waiting for put-away, or orders waiting at pack.
- Cycle time: start to finish for one process. Example: order cycle time is time from order drop to ship confirm.
- Dock-to-stock: time from trailer arrival to inventory ready to pick (received, verified, labeled, and put away, or at least system-available in the right location).
If systems are limited, run a basic log sheet for 10 to 14 days. A supervisor can do this with a clipboard:
- Date, shift, volume (orders, lines, pallets)
- Start and end times for receiving, put-away, pick, pack, ship confirm
- Top 3 reasons for waits (no door, no forklift, missing labels, no space)
One warning: averages hide pain. A few good days can mask the days that break service. Instead of only looking at the mean, review the worst 10% of days (or worst 1 to 2 days each two-week window). That is usually where the truth lives.
Use capacity clues: units per labor hour, forklift utilization, and packing rate
Once you know where time goes, check if capacity matches demand. These metrics help you separate a real labor constraint from messy processes.
- Units per labor hour (UPLH): total units handled divided by total labor hours. If UPLH stays flat while volume rises, capacity is capped.
- Forklift utilization: time a lift is moving loads divided by available time. Low utilization with high waiting usually means travel, congestion, or dispatch rules are the issue, not the lift count.
- Packing rate: cartons or orders packed per hour per station (and per packer). A stable rate with a growing queue points to pack as the constraint.
Here’s the simple tell:
- If people are fully busy and output is flat, labor or equipment can be the constraint.
- If people are busy but doing rework (searching, relabeling, fixing picks), then the process is the constraint.
In 2026, staffing churn adds another layer. Recent data shows warehouse turnover can run 36% to 49% per year, which means “we’re short” often really means “we’re always training.” Track two practical measures alongside your rate KPIs:
- Training time to standard by role (how many shifts until a new hire hits target rate).
- Skill coverage by role (how many certified people you have for receiving, reach truck, replenishment, packing, shipping clerk).
Don’t ignore quality, errors and rework often create the real jam
Many warehouse bottlenecks look like capacity problems, but they are really error factories. Watch for:
- Mispicks (wrong item, wrong quantity)
- Short ships (order closes, but carton is missing items)
- Damage (inbound or outbound)
- Wrong labels (carrier, hazmat, address, SSCC)
- Inventory mismatches (system says it’s there, shelf says no)
One error doesn’t stay in one department. A mispick triggers exception handling, repicking, repacking, customer service tickets, inventory adjustments, and sometimes returns. That is extra touches across the warehouse, plus time you can’t plan.
A simple way to quantify impact:
- For one week, log rework minutes per 100 orders (include repicks, label fixes, damage clean-up, recounts).
- Convert to labor hours per week:
weekly rework hours = (rework minutes per 100 orders × weekly orders) ÷ 6,000.
When that number surprises you, good. It often explains why “everyone is working” but the dock still misses cutoff.
Find the constraint step with a simple test: where does work pile up every day?

Numbers point you in the right direction, but the floor confirms it. Use a repeatable walk to find the constraint step.
Walk the same route at the same times for a week, for example 9:30 a.m., 1:00 p.m., and 4:00 p.m. Each lap, take a photo or quick count of:
- Pallets in inbound staging
- Pallets waiting for put-away
- Replenishment requests waiting
- Orders waiting to pack
- Cartons waiting for ship confirm
- Trailers waiting for doors
The bottleneck is the area where queues grow daily and don’t clear without overtime. Confirm your observation with your time and rate logs, then ask operators one direct question: what triggers the pile-up here? Their answers usually match the data, and they often point to the fastest fix.
Fix the biggest delays first, what to change in layout, labor, and rules
Once you know where work piles up, fix the constraint before you polish everything else. Otherwise, you just move the mess. Start with low-cost process and layout changes, run a small pilot for a week or two, then scale what works across the Warehouse.
A good rule is simple: change one thing, measure one result. If the queue moves, keep going. If it stays, you attacked a symptom.
Speed up picking, cut travel, slot smarter, and keep pick faces full
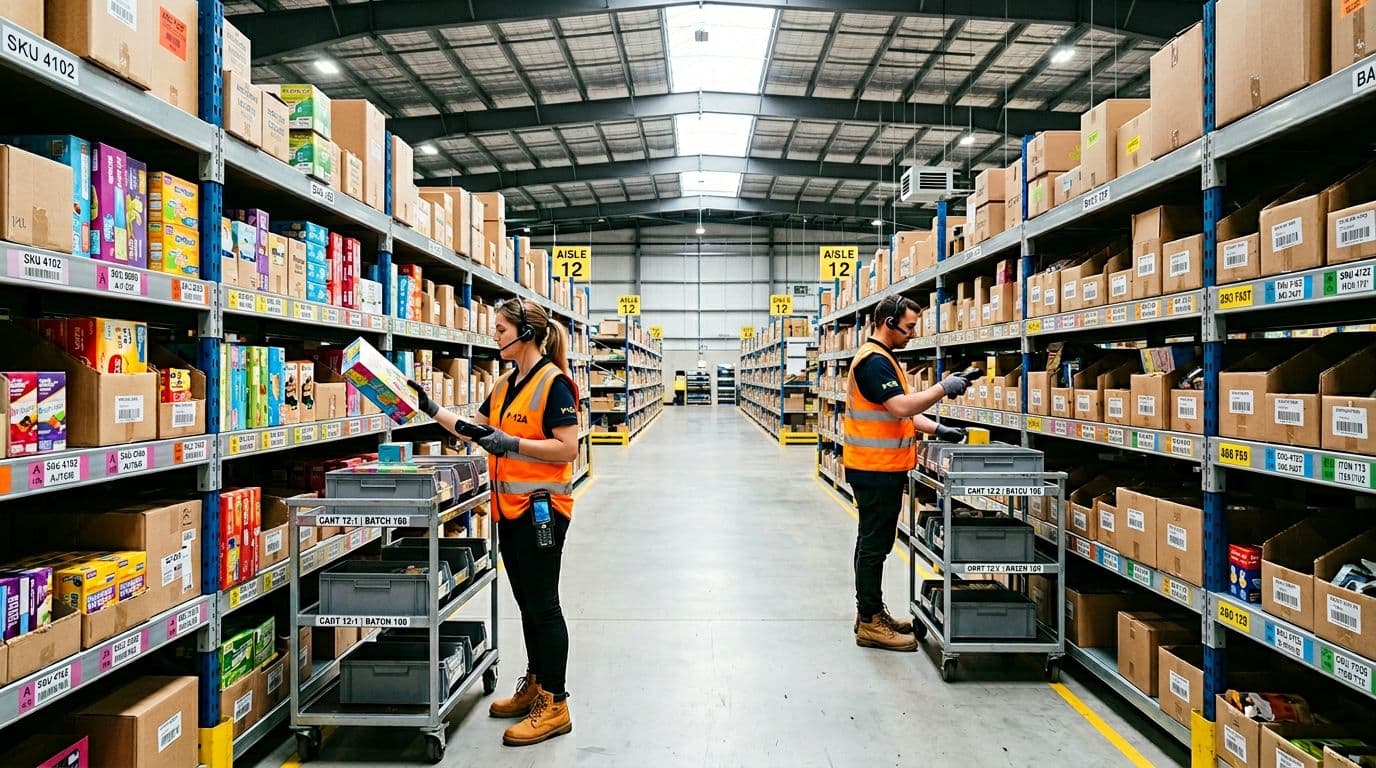
If picking is slow, travel is often the silent thief. Bad slotting turns every order into a long walk, and it also triggers constant replenishment runs that pull labor away from picking. You’ll see it as congested hot aisles, pickers doubling back, and a steady drip of “I need a replenish” calls all day.
Start with ABC velocity slotting. Classify SKUs by how often they’re picked:
- A items (fast movers) go closest to pack out and at easy reach heights.
- B items sit behind them, still accessible but not prime real estate.
- C items can live farther out, higher, or deeper in reserve.
Then reduce touches. If your pickers waste time bouncing across the building, a different pick method can help. Zone picking fits when your layout has natural areas (like aisles by product family). Batch picking fits when many orders share the same SKUs (common in ecomm). Either way, the goal is fewer trips and fewer handoffs. For travel-heavy operations, apply the same thinking as reducing picker travel time in warehouses, even before you change any tech.
Finally, protect the pick face. Empty locations create stoppages, exceptions, and repicks. Set replenishment triggers that fire early enough to stay ahead of demand:
- Use min and max quantities per pick face (simple and reliable).
- Trigger replenishment by days of cover for A items (for example, replenish when you have less than one shift left).
- Time replenishment to off-peak windows so lifts are not fighting pickers in the same aisle.
A fast pilot that builds confidence: pick your top 20 SKUs by lines, re-slot them near the front, set clear min-max levels, and run batch or zone picking just for orders containing those SKUs. Compare travel time, lines per hour, and replenishments per shift before and after. If it works, expand to the top 100.
If your best sellers live far away, your layout is charging you rent every hour.
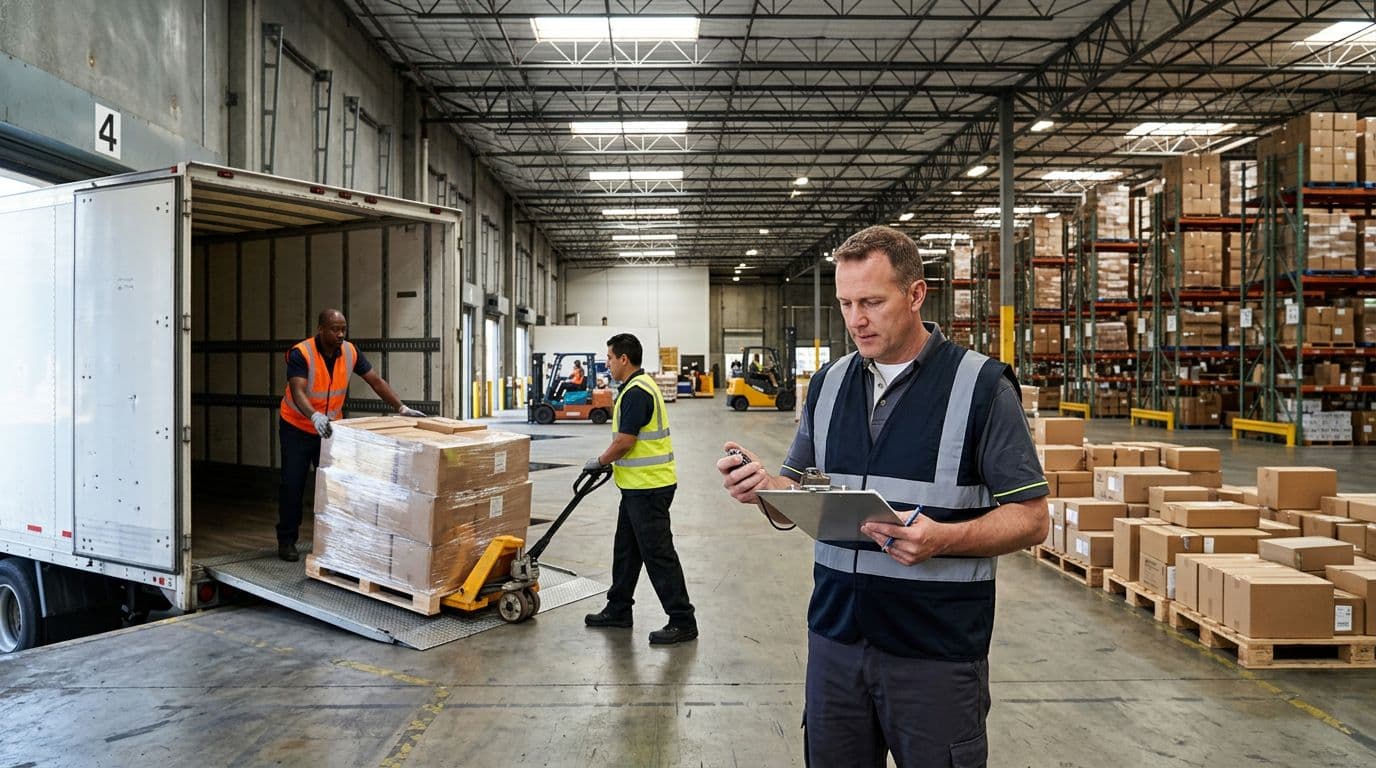
Unclog receiving and put-away, use standards, appointments, and clear staging
Inbound flow sets the mood for the whole day. When receiving clogs, the ripple is brutal: trailers wait, doors stay blocked, put-away gets delayed, and pick faces go empty later. Many Warehouse teams treat yard and dock delays as “outside issues,” but inside the building, they show up as stockouts, congestion, and missed cutoffs.
First, get basic control with appointments. You don’t need fancy software to start. Use a shared calendar or dock schedule and require:
- Arrival window (for example, 30 to 60 minutes)
- Load type (pallets, floor load, mixed)
- Special handling (hazmat, temp-controlled, serial capture)
- Expected unload time based on history
When you have ASNs (advance ship notices), use them for pre-receiving. Build the receipt in the system before the truck arrives, so your team only verifies and exceptions out what’s wrong. That one step cuts check-in time and reduces “paperwork parking lots” on the dock.
Next, lock down labeling standards. Inbound product should get consistent IDs and location-ready labels early, not after it’s been moved twice. Common standards to define and stick to:
- One pallet ID per pallet (no mixed handwriting)
- Barcode quality rules (placement, size, scannability)
- Clear ownership for relabeling when vendors do it wrong
Also separate flow at the dock. Create a fast put-away lane for clean, compliant freight, and a problem freight lane for shortages, damages, missing labels, or mixed SKUs. This stops exceptions from blocking everything else. Your best receivers should live in the problem lane because that’s where judgment matters.
The payoff is simple: faster door turns, less staging sprawl, and inventory that becomes pickable sooner.
Reduce packing and shipping backlogs with better work balance and simple QA
Packing backlogs often happen because picking releases work like a firehose. Meanwhile, packing is a funnel. If you push more into the funnel than it can handle, cartons stack up, orders miss carrier cutoffs, and the team starts re-handling finished work just to make space.
Match pick release to pack capacity. Set a few plain rules:
- Release waves based on available pack stations and headcount, not just order priority.
- Hold back slow, complex orders when pack is behind, then feed high-velocity singles to keep flow moving.
- Stop releasing new work when the pack queue hits a visible cap (a physical limit works best).
Wave rules can stay simple, or you can formalize them with wave picking WMS essentials if your operation already uses waves. Either way, the point is pacing. You want a steady drumbeat, not a surge and crash.
Carton choices matter too. Basic cartonization reduces rework and void fill:
- Use 2 to 4 “go-to” box sizes that cover most orders.
- Store boxes within one step of each station.
- Avoid over-boxing, it wastes time and drives DIM weight costs.
For QA, put checks where they catch errors once. A quick scan at pack out (item to order, label to carton) beats re-checking at shipping and again at the dock. Keep QA light:
- Check high-risk orders (high value, hazmat, serial-controlled)
- Audit a small sample of routine orders
- Fix the top error cause each week, instead of adding more inspection steps
Design for people, training, staffing, and shift plans that prevent slowdowns
In 2026, labor is still tight, and turnover stays a fact of life in many warehouses. That means your “system” is only as strong as your training and coverage. When one skilled person goes to break and the line stops, you don’t have a people problem, you have a design problem.
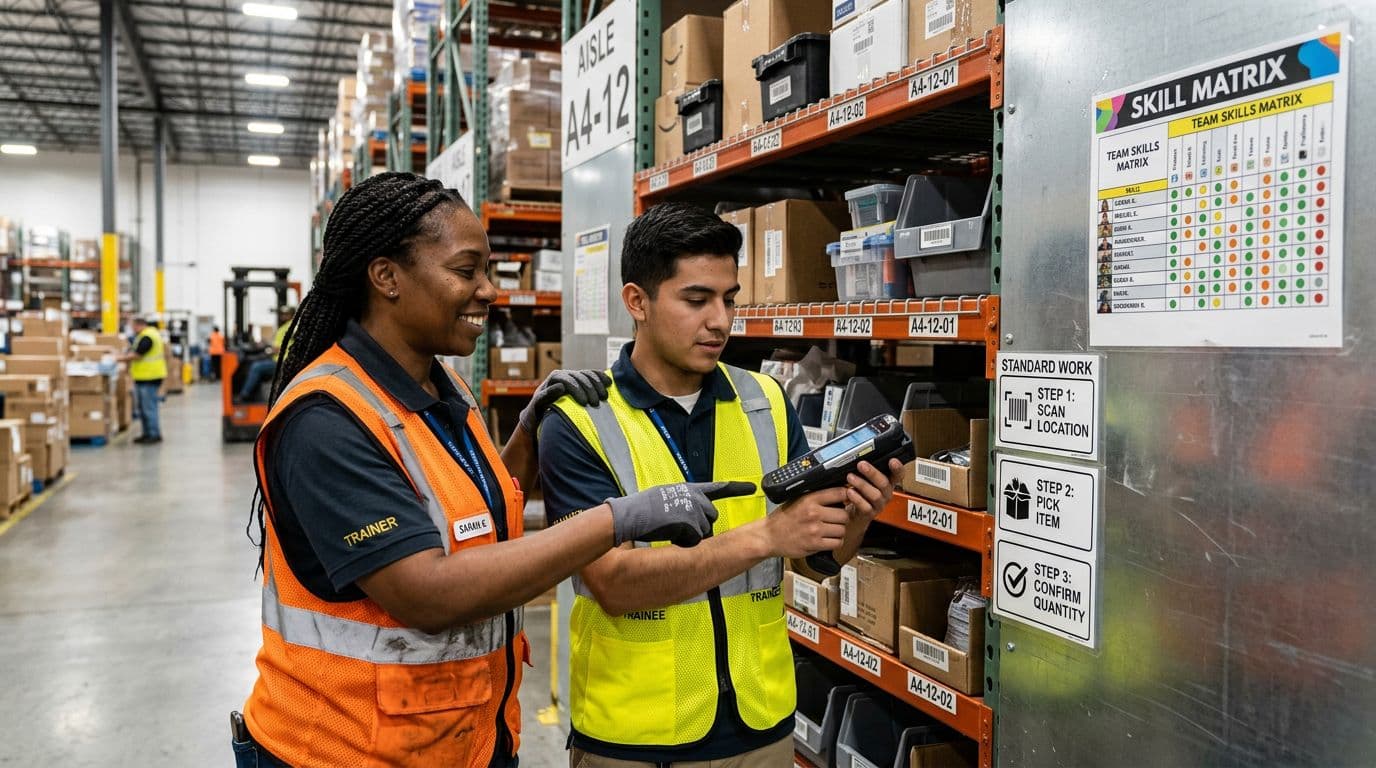
Build a simple skill matrix by role (receiver, put-away driver, replenisher, picker, packer, ship clerk). Then set a minimum coverage rule per shift, including breaks and lunches. Cross-training is what makes that real. Aim for depth in the constraint areas first, not equal training for everyone.
Keep training short and practical:
- Write standard work in plain steps with photos, posted at the point of use.
- Use a buddy system for the first few shifts, so new hires get feedback fast.
- Create short learning paths (Day 1 basics, Day 3 speed, Week 2 exceptions) instead of one big info dump.
Also rotate heavy tasks. When the same people always do the hardest work, speed drops and injuries rise. A rotation plan spreads load, keeps energy up, and makes callouts less damaging because more people can step in.
Most importantly, staff to protect flow at the constraint. It’s better to add one trained person to replenishment or packing at the right time than to add three untrained people everywhere else.
Keep bottlenecks from coming back with a simple control plan
A Warehouse fix that sticks needs a loop, not a speech. Once the queue clears, old habits creep back in, especially when volume spikes or staffing shifts. The answer is a simple control plan that spots drift early and forces small course corrections.
Use a lightweight cadence your team can keep: daily visual checks on the floor, a weekly KPI review with clear actions, and a monthly deep dive to confirm the real constraint did not quietly move.

Set a short list of weekly KPIs and tie each one to an action
Limit the list so people actually use it. Track 5 to 7 measures, review them the same day each week, then trigger a specific response when one drifts.
Here’s a practical set that catches most bottlenecks fast:
- Dock-to-stock: If it rises, add a short extra replenishment and put-away window (off-peak), and tighten receiving triage so “clean” freight skips the problem lane.
- Order cycle time: If it stretches, adjust labor at the constraint step (usually pack or replenishment), and reduce pick release until pack queues stabilize.
- Pick rate: If it drops, run a quick reslot of the top movers and clear empty pick faces before the next wave.
- Pack rate: If it dips, rebalance work (move one floater to pack, simplify carton choices, and stop feeding complex orders into a jam).
- Inventory accuracy: If it slides, schedule focused counts on the most picked locations and review buffer rules (see safety stock optimization to prevent “phantom stock” from turning into constant exceptions).
- Rework minutes: If it spikes, isolate the top cause (labels, damages, mispicks) and fix that one cause this week, not five things halfway.
- Trailer dwell time: If it climbs, change appointment limits (cap floor loads per hour, protect doors for hot inbound), and escalate repeat offenders with proof.
A KPI without a preset action is just trivia. Decide the response before the number turns ugly.
Run quick root-cause reviews that focus on facts, not blame
Keep reviews short, calm, and repeatable. You want a pattern, not a courtroom. Use this script in a 10-minute huddle, then capture the decision in one sentence.
- What happened? (use time, volume, and the KPI)
- Where did the queue form? (dock, put-away, pick, pack, ship confirm)
- What changed? (staffing, mix, carrier cutoff, late inbound, system issue)
- What will we try next? (one test, one shift, one owner)
- Who owns it, by when? (name and date)
Add 5 Whys when the issue repeats. Also sanity-check whether you found the real constraint or just a one-day event. A storm of late trailers can be real, but if pack has queued work every day for three weeks, that’s the true choke point.
Know when it’s time for tools, real-time visibility and flexible automation
A control plan exposes when effort alone will not hold the line. Upgrade when you see these triggers week after week:
- Too many manual touches (paper checklists, double entry, repeated relabeling)
- Inventory accuracy that never stays stable, even after cycle counts
- Constant dock surprises (unplanned arrivals, missing ASNs, unclear priorities)
- Rapid growth that makes “walk the floor and ask” stop working
Modern options do not have to be fancy to pay off. Strong WMS features help you pace work, prioritize replenishment, and keep orders from flooding a constraint. Real-time scanning reduces search time and closes gaps that create rework (for example, pallet tracking for productivity). Analytics can improve labor scheduling and dock appointments, so you staff the pinch points before queues form. If travel is the anchor, mobile robots can reduce long walks and keep pickers picking.
The goal is simple: fewer surprises, fewer touches, and a Warehouse that stays under control even on a bad Tuesday.
Conclusion
Bottleneck analysis works when you keep it practical and repeatable in your Warehouse. First, map the real flow (including replenishment, exceptions, and returns) so you can see every handoff and wait. Next, measure where work piles up using a week of simple timing, queue counts, and a few honest rate and error metrics. Then fix the true constraint with targeted changes in layout, staffing, and release rules, not random tweaks. Finally, lock in controls with a tight KPI loop and preset actions so the backlog does not quietly return.
Start small so you can move fast, one process, one shift, one week of data. If tech gaps keep causing rework, you can also compare options like a best WMS for 3PL warehouse bottlenecks or improve coordination with centralized WMS for cross-location bottlenecks.
Before your next peak week, run this 3-step checklist:
- Pick one visible queue, then time it daily for 5 workdays
- Change one rule (release, staffing, slotting), then re-measure
- Set one control trigger, then assign a single owner
The goal is flow, because flow beats overtime every time.